Climate Data for over 100 Cities
If you’re a nomad or frequent traveler, you probably invest quite some time planing your itinerary. Websites like Wikitravel and Nomad List are extremely helpful, but over the last three years I found myself more and more digging into weather data to structure my adventures around. Until now I used the climate section of Wikipedia entries and compared them carefully. It works, but as you can see here, it can get complex real quick, and I found that especially the case for long trips across climate zones.
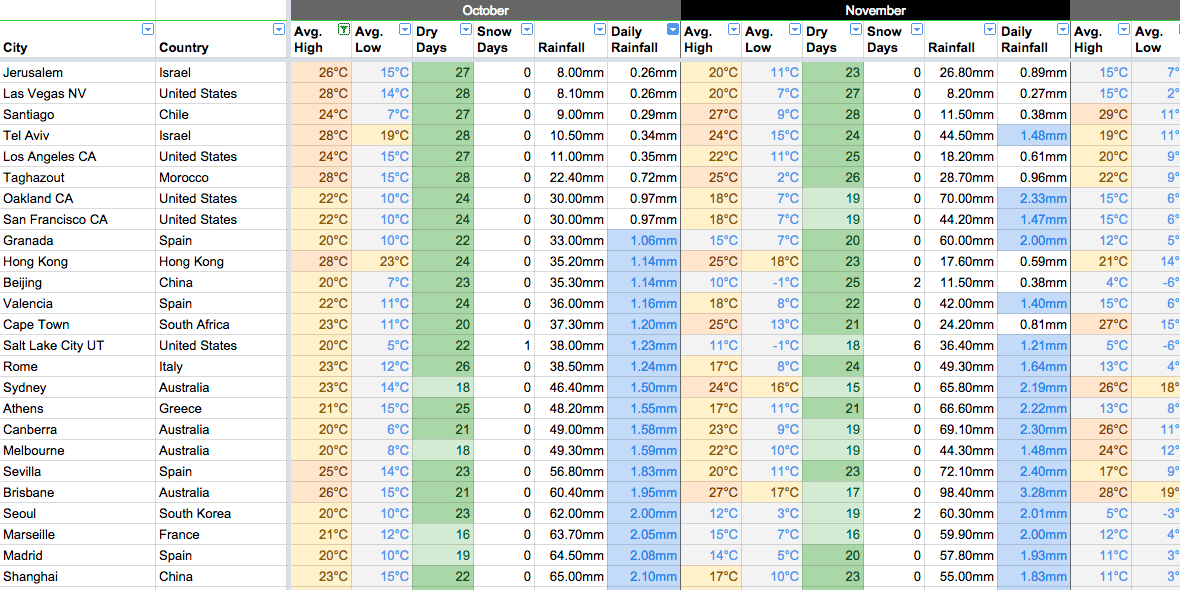
To make all that easier, I created a Climate Sheet, which features over one-hundred destinations and counting. It includes the average high and low temperature, dry days, snow days, and rainfall, for every month. Filter and sort by whatever you like to find your next destinations.
Climate Sheet
Click the image below or this link to open the spreadsheet.
Note: Unfortunately Google doesn’t grant access to configured filters of view-only spreadsheets, so you need to create your own temporary filter view
(Data > Filter views… > Create new temporary filter view), or save a copy of the spreadsheet.
Climate JSON
Friends asked me to provide a JSON of it, so I wrote a conversion script, but first a note about the data.
Source of the complete weather data is the excellent Forecast.io API which you might know from the Dark Sky app.
I never had the intention to create a climate data file in the first place, but I see how it can be useful to play around with. If you’d like to create a serious weather application however, I recommend using the Forecast.io API directly. They offer historical data, but you’ve to aggregate it yourself, so in order to get the monthly data you need to request every single day of a month, and it might be a good idea to do that for a few years to improve data quality.
Anyhow, if you just would like to play around, feel free to check out the JSON, which you find here on GitHub.
Note: The temperature data is in Celsius, and rainfall in mm.
Tip: Divide
rainfallby the number of days of the month, to calculate the average daily rainfall.
Structure
I included an id to easily hook it up with related data. Otherwise the JSON should be self explanatory. Just remember to access the monthlyAvg array with the correct index (month number - 1).
[
  {
    "id": 1,
    "city": "Amsterdam",
    "country": "Netherlands",
    "monthlyAvg": [
      {
        "high": 7,
        "low": 3,
        "dryDays": 19,
        "snowDays": 4,
        "rainfall": 68
      },
      {
        "high": 6,
        "low": 3,
        "dryDays": 13,
        "snowDays": 2,
        "rainfall": 47
      },
      …
    ]
  },
  {
    "id": 2,
    "city": "Athens",
    "country": "Greece",
    "monthlyAvg": [
      {
        "high": 12,
        "low": 7,
        "dryDays": 21,
        "snowDays": 1,
        "rainfall": 53
      },
      …
    ]
  },
  …
]
Additional destinations and support
Feel free to tweet me if you’d like to see a specific city added. And if you found this helpful, why not buy me a beer?